To enhance your experience with Vector, we developed tools for linking chart windows by either time frame or crypto, or even both, bringing convenience and comfort to your trading routine.
Linking charts by time frame
To link charts by time frame, click the clock icon on the upper-right side of the chart and select a Link Number. It will replace the clock icon once a link is assigned.
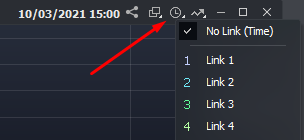
Analyze different assets in the same time frame, using the timeline to monitor charts simultaneously. Zoom adjustments will also propagate to all charts on that group:
Linking charts by assets
To link charts by assets, click the arrow icon this time, also on the upper-right side of the chart, and select a Link Number. It will replace the arrow icon once a link is assigned:
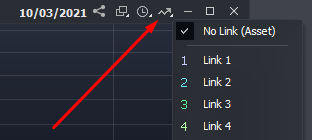
This option enables the investor to analyze one asset at a time in multiple time frames:
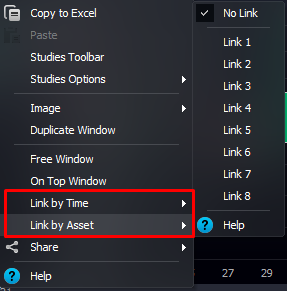
If your chart windows are Contained, you may find it more convenient to right-click the chart and select a linking option from the list:
Other tools available on Vector, like SuperDOM, Market Depth, and Volume Profile, may also be linked by assets, automatically synchronizing with charts:

The number of windows you can open and apply links to depends on your Vector license.
Hey! Was this content helpful?
Please rate it below! It's important that we work together to make our Help Center even more complete.
Happy trading!