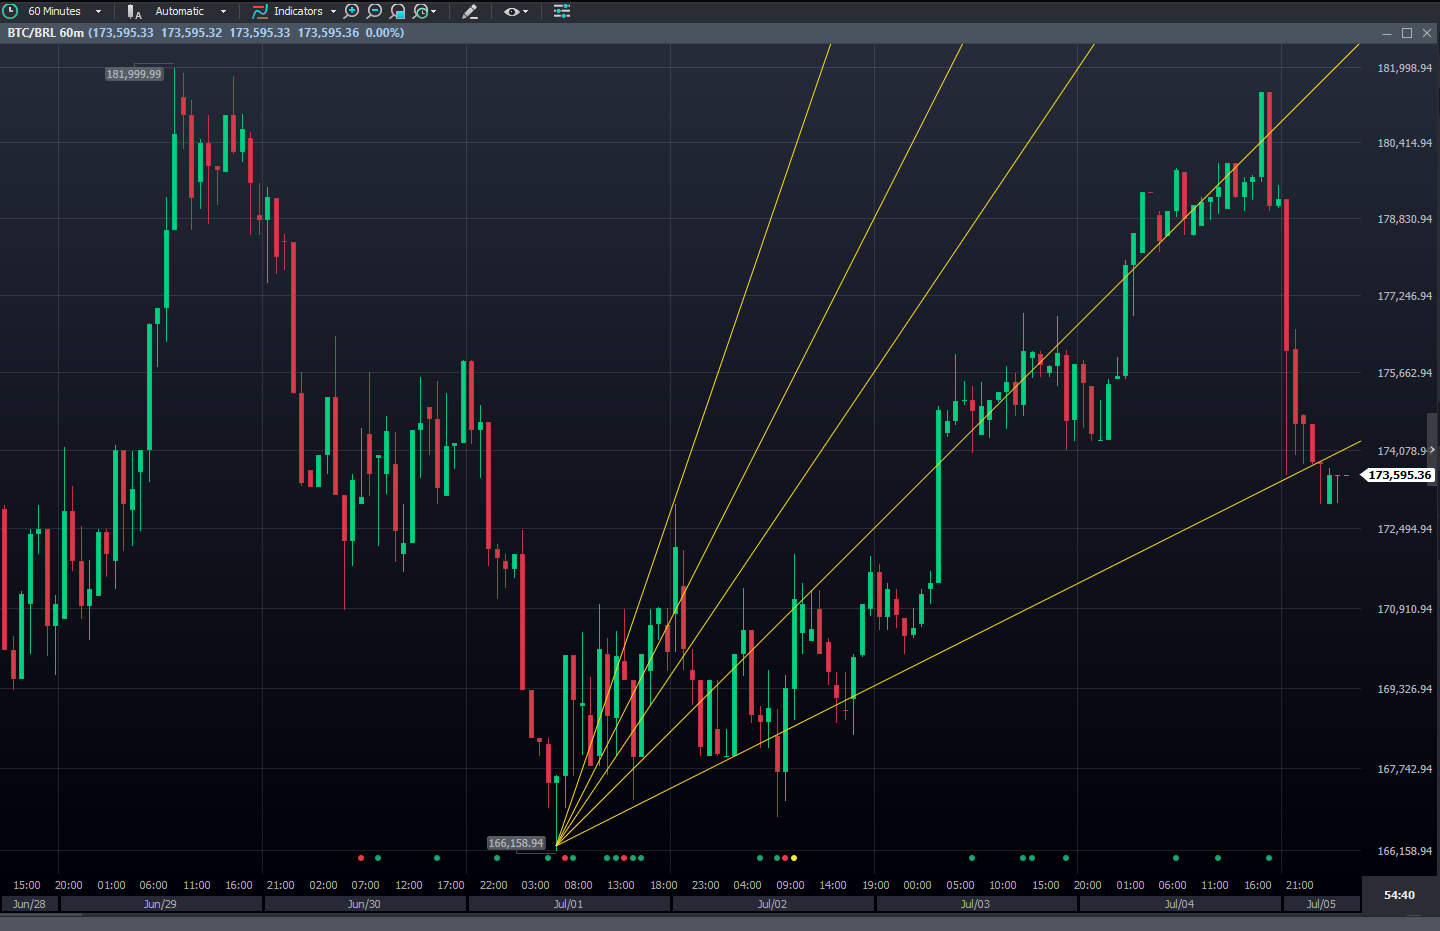
The basis of Technical Analysis has traditionally used study tools with horizontal levels to identify market trends. The most commonly known studies are Support and Resistance lines. The Gann Fan Study, in turn, uses diagonal levels for analyzing charts. Access the Gann Fan on the Vector Study Bar by clicking the set-square shape icon.

Much more than a tool
The Gann Fan is the graphic representation of the methodology developed by the famous 20th-century trader William D. Gann, and it's based on three pillars: geometric angles, price and time coordination principles, and the Cardinal Cross. Considered a financial astrologer on Wall Street (he predicted the 1929 crash using his studies), Gann made about 50 million dollars in his lifetime.
Curiosities aside, a Gann Fan is made up of diagonal lines called Angles of Gann. These lines are plotted on the chart to show different levels of support and resistance for the asset in question.
Gann Angles
Originally, William idealized his angles as nine lines. The first 1/1 or 45º line is the most important, representing a price unit for a unit of time. Another eight lines are added above and below, forming the following fractional:
1/8;
1/4;
1/3;
1/2;
1/1 or 45 degrees;
2/1;
3/1;
4/1;
1/8.
Principles of price and time coordination
According to Gann, the perfect balance in the market takes place when two variables (price and time) move in sync. Summing up, if prices are above the 45º angle, the market is considered Bullish. The opposite suggests a bear market.
Cardinal Cross
Here it is assumed that the market moves in quadrants, considering a supposed relationship between time and price. For instance, at 1/8, the market moved one unit of time every eight price units.
Hey! Was this content helpful?
Please rate it below! It's important that we work together to make our Help Center even more complete.
Happy trading!