In some cases, independently of your computer’s settings, certain windows on Vector can demand more resources than others, causing performance drops.
Indicators such as Volume Profile (added directly on the chart or on a separate window) and Volume at Price, or tools such as Times & Sales, depending on the asset/filtered interval for display, can take relatively more time to load, affecting the platform’s general performance.
Do you use Volume Profile, Volume at Price, or Times & Sales on your desktop?
If so, depending on the filtered interval for display and your internet’s connection conditions (click here to make a few tests, content in Brazilian Portuguese), the loading process is heavier, resulting in unwanted behaviors.
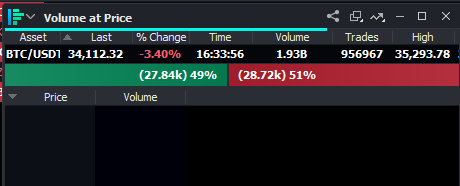
Example of a performance drop when loading Volume Profile data.
Note the blue line below the asset's title bar, indicating data received for later display on the chart.

Procedures
The number of opened windows can affect Vector's general performance. Close the ones that aren’t being used at the moment to avoid the behavior pictures below;

Reduce the filtered interval for display on the necessary windows that will remain on your desktop, according to the steps below.
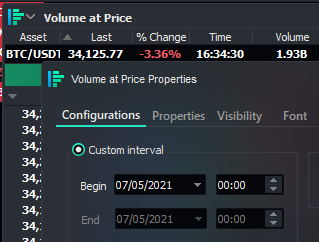
Right-click the VAP or the T&T > access Properties > Configurations > Custom interval. Change both the Begin and End dates to the current day.

It’s also possible to check whether there is an active filter on the window just by observing its title bar. On the example below, Times & Sales is displaying the information “Starting today”, indicating that there isn’t a filter.

Another way to enable Volume Profile would be to right-click the chart and select the option “Volume Profile” to display the information on the price scale.
Hey, did you find the content of this article helpful?
Don’t forget to rate us below! We know how important it is for us to work together so that we can make our Help Center even more complete!
Good trades!