
There is a problematic situation regarding the definition of tops and bottoms in technical analysis: the lack of parameterization. Usually, tops and bottoms are classified empirically and, consequently, so are trends. Therefore, the trader’s experience is in charge of the definition through the visual aspect.
The Top Bottom Detector indicator helps to systematically parameterize the definition of trends.
Concept
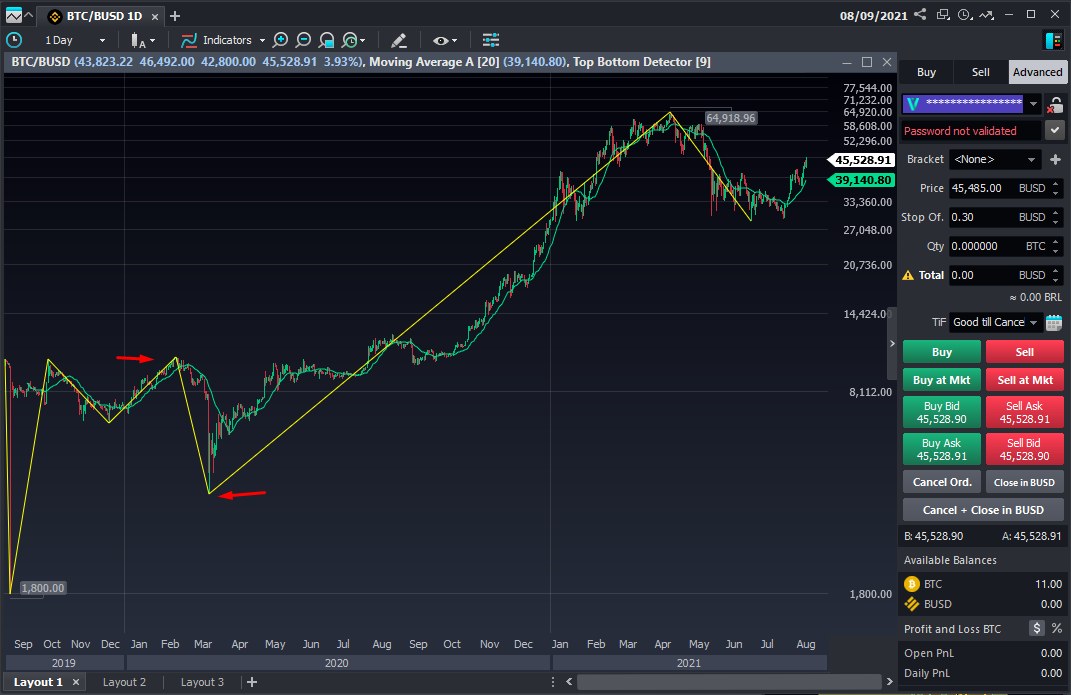
The Top Bottom Detector is a tool that creates parameters for the detection of tops and bottoms, automatically applying a line that runs with the price. Their extremes are classified either as tops or bottoms.
In the image below, we have a daily Bitcoin chart with the Top Bottom Detector functionality line in yellow:
Adding it to your charts
Top Bottom Detector is available in all versions of Vector.
To add it right-click the chart, select Add Indicator, and type Top Bottom Detector.
Note
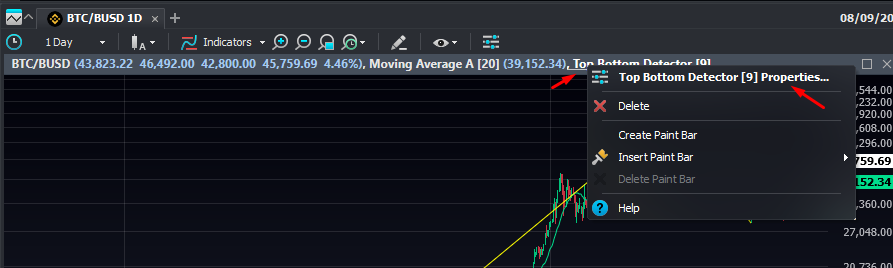
The smaller the indicator’s selected interval, the faster and more sensitive will be the detection of tops and bottoms. The interval must be defined according to volatility and the market’s current state (tendency or congestion). To access and change settings right-click the indicator's title and click Properties.
Hey! Was this content helpful?
Please rate it below! It's important that we work together to make our Help Center even more complete.
Happy trading!