
The combination of various candles forms patterns that contain relevant information about both current and the future market’s behavior. There is also a considerable group of patterns composed by a single candle that signals the market’s prevailing feeling.
Usually, candle patterns are interpreted subjectively, based on the market’s behavioral logic.
The candles’ quantitative analysis is an alternative to obtain additional and relevant information in this very popular form of price representation, and the Candle Code indicator has been developed with this mindset.
Candle Code’s structure
The candle consists of a body and its upper and lower shadows. The formula used to quantify a candle assigns the greatest weight to the body color, then to its size, and finally the smallest weights to the upper and lower shadows.
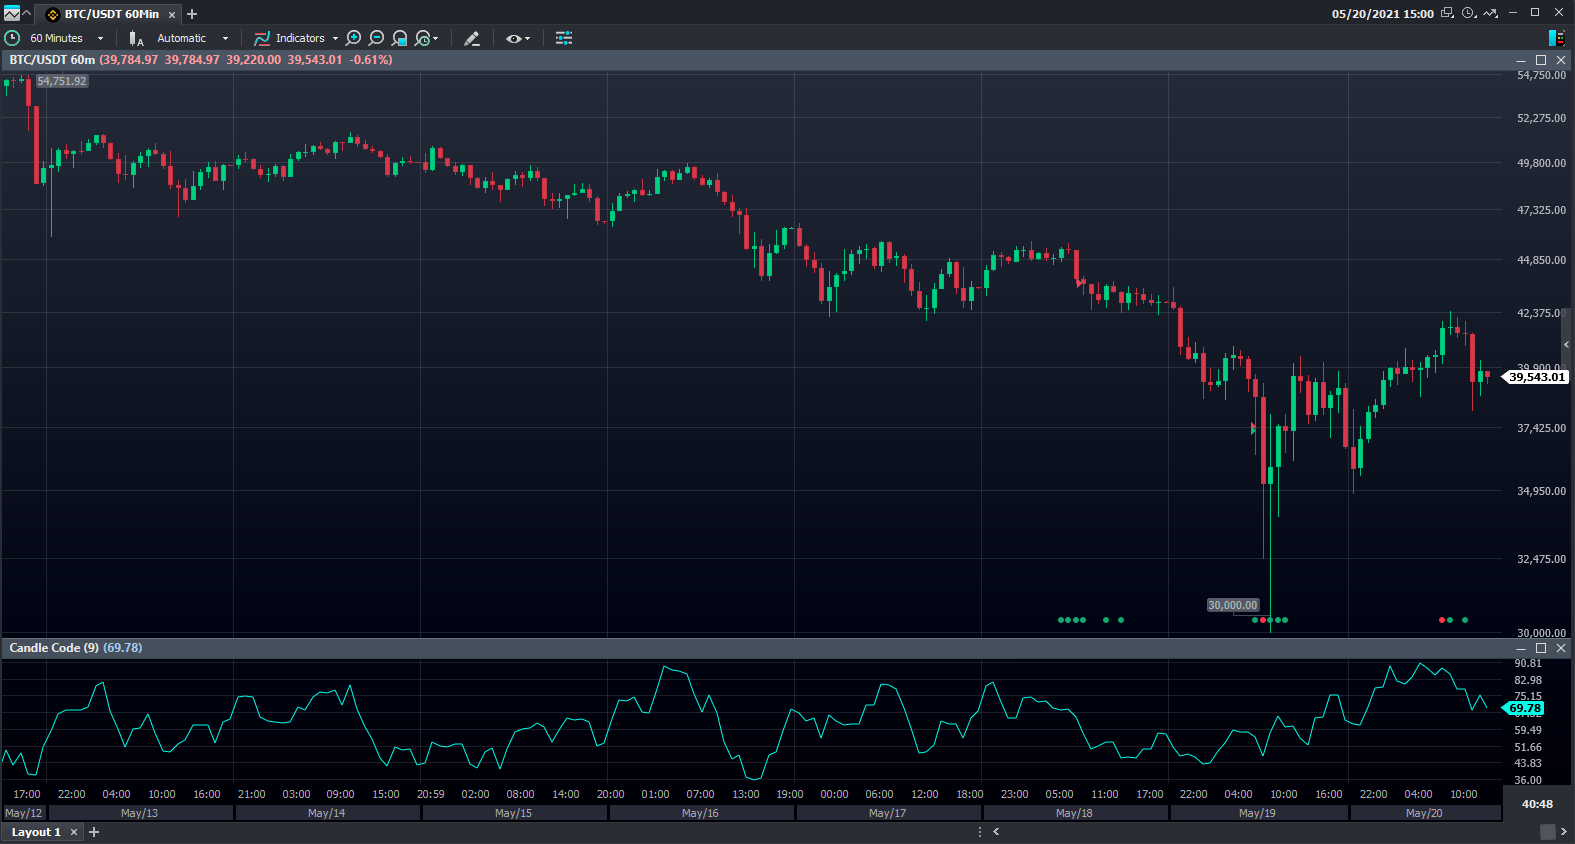
The result of these 4 elements’ sum is the Candle Code’s value, which varies from 0 to 127. The obtained curve is subsequently smoothed by two exponential averages, of 3 and 21 intervals, in which the final values oscillate in an approximate range between 20 and 80. The standard deviation determines the body and shadows’ size’s classification (small, medium, large).
Adding it to your platform
The Candle Code indicator is available in the Basic, Standard, and Pro versions of Vector and it's possible to add it to your platform through the following steps:
Right-click the chart, select "Add Indicator" and type "Candle Code".
Hey! Was this content helpful?
Please rate it below! It's important that we work together to make our Help Center even more complete.
Happy trading!