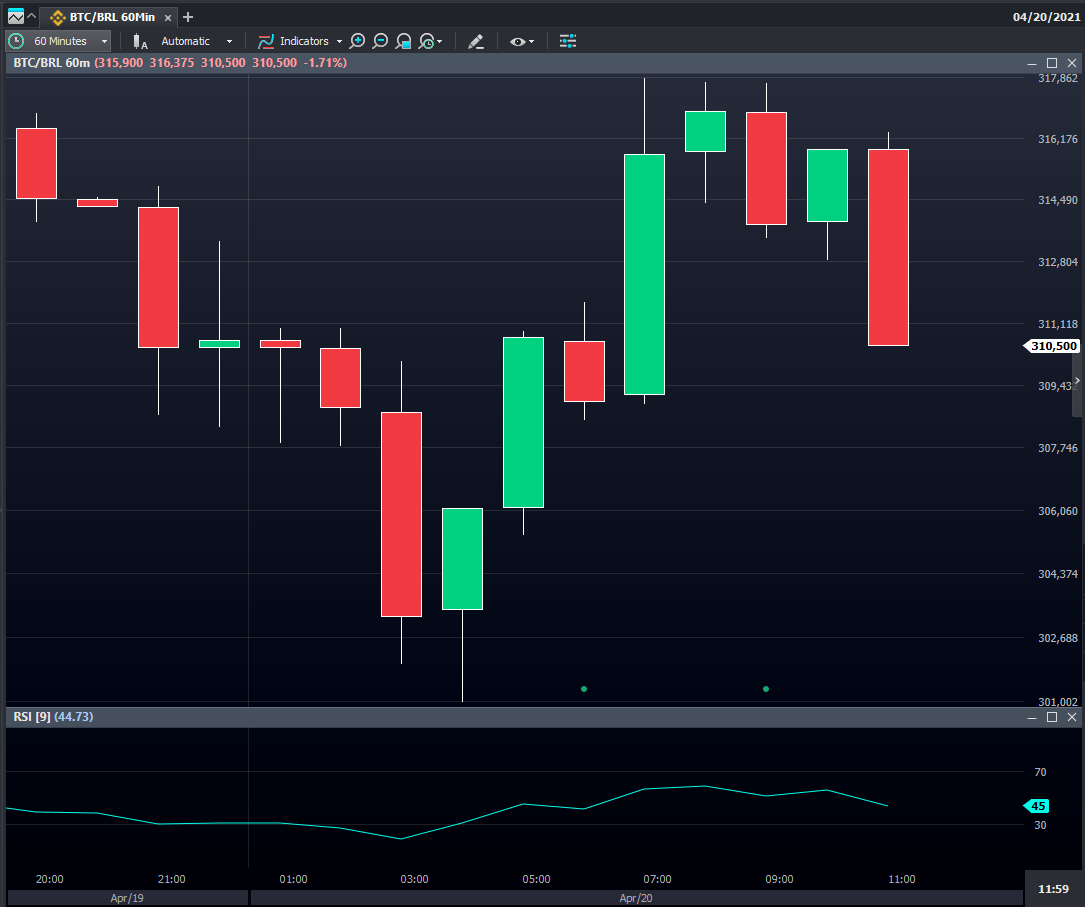
RSI is one of the most well-regarded indicators by traders because it is extremely useful in multiple situations. It can be used by itself or in conjunction with other analysis techniques (which is always recommended).
Created in 1978 by Welles Wilder, RSI measures the “strength” of an asset. It ranges from 0 to 100 and there are four main ways you can use it in your trades.
RSI is available in all versions of Vector platforms.
To add this indicator, right-click the chart, select “Add Indicator” and type “RSI”.

Tops and Bottoms
Also known as excessive buy or sell conditions. RSI usually generates a top above 70 and a bottom below 30. Many times, these tops and bottoms generated at RSI are more clearly visualized than in the own asset’s price indicator chart.
The interpretation is that, when the asset is above 70, it’s in an excessive buy condition, that is, prices are high, which weakens the buying pressure and opens space for a correction.
Similarly, when the asset is below 30, there have been a lot of sales and the asset is currently cheap, which suggests buying opportunities and can originate a bullish movement. Some authors believe that, in a large bullish trend, a value of 80 is more appropriate to signal the condition of excessive buying, while in a bearish market the lower limit can be adjusted to 20.
Chart Formations
RSI forms patterns such as OCO or triangles that often aren’t visible on the price chart, but are perfectly valid and may indicate a trend continuation or reversal.
Support and Resistance
Support and resistance lines are thoroughly valid on RSI, suggesting respectively regions of buy and sell pressure.
Divergences
Searching for differences is one of the main uses of RSI. The divergence happens when the RSI movement "disagrees" with what is happening with the price. For example, occasionally the price chart makes a new top that is higher than the previous one, while RSI does not follow this movement and falls below its last top.
What is happening?
RSI is showing you a sign of weakness in the bull market and it may be a good chance to sell. Needless to say, the opposite is also true, if prices make a new fund and IFR doesn’t, a buying power may be emerging.
Other Characteristics
RSI can be calculated over different time intervals, of which the most common ones are 9, 14, and 25. There isn’t a formal rule for the number of days to be utilized, some intervals work better for certain markets, so it’s necessary to test and determine which one is better suited to the papers and indexes you are analyzing.
RSI’s calculation is done in the following way:
In the formula, “A” represents the average of the closing prices of the interval’s high days, while "B" represents the average of the closing prices of the interval’s low days.
As previously stated, there isn’t a defined rule to establish the interval for calculating averages, but the shorter the interval the greater the indicator’s volatility, that is, RSI will oscillate more.
RSI is very versatile and can be of great help on your trades. Many analysts agree that RSI is very efficient in helping to confirm an idea or hypothesis about the market. It’s possible to trade based solely on this indicator, but this practice is not ideal.
The important thing is to have a methodology that combines a few analyses techniques, and RSI can be an excellent trick up your sleeve.
Hey, did you find the content of this article helpful?
Don’t forget to rate us below! We know how important it is for us to work together so that we can make our Help Center even more complete!
Good trades!

