OBV (On-Balance Volume) is a momentum indicator that relates price changes to volume variations. It was created by Joe Granville and the aim is to map volume flux’s direction, that is, to determine whether it’s coming in or out of the asset’s volume.
This indicator is fairly used by traders and its calculation considers two scenarios:
- If the current day’s closing is superior to the previous day’s, all of the volumes are considered bullish volumes.
- If the current day’s closing is inferior to the previous day’s, all of the volumes are considered bearish volumes.
This indicator is available in all versions of Vector platforms and it’s possible to add it through the following steps:
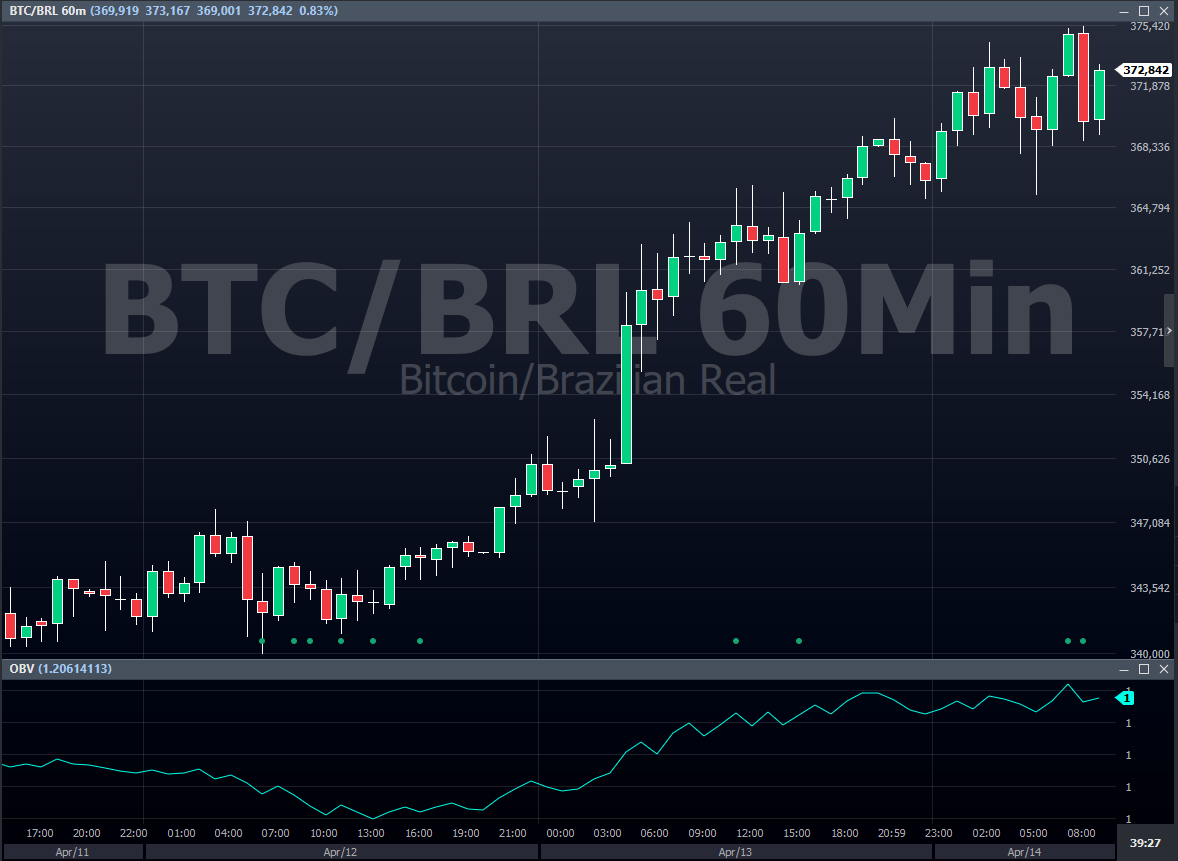
Right-click the chart, select “Add Indicator” and type “OBV”:

This way, it’s possible to confirm the market trend by confirming the price from the volume, considering that this information is obtained through OBV.
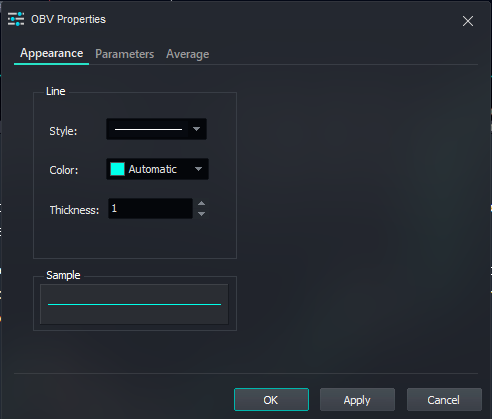
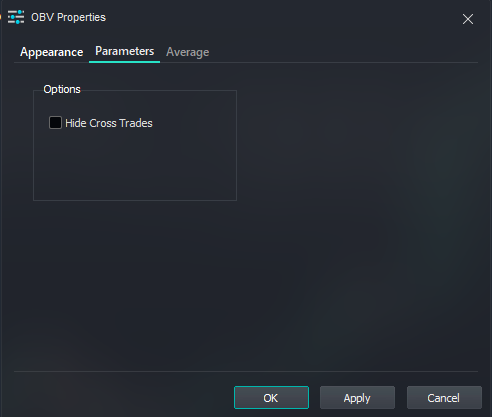
Moreover, by right-clicking OBV and accessing OBV Properties, you can set the indicator according to your preference by altering its appearance and other specific parameters, as illustrated in the image below:


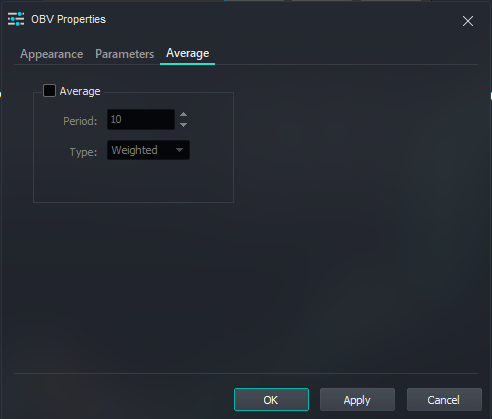
Furthermore, it’s also possible to add a moving average to your OBV through the Average tab on OBV Properties:

Hey, did you find the content of this article helpful?
Don’t forget to rate us below! We know how important it is for us to work together so that we can make our Help Center even more complete!
Good trades!