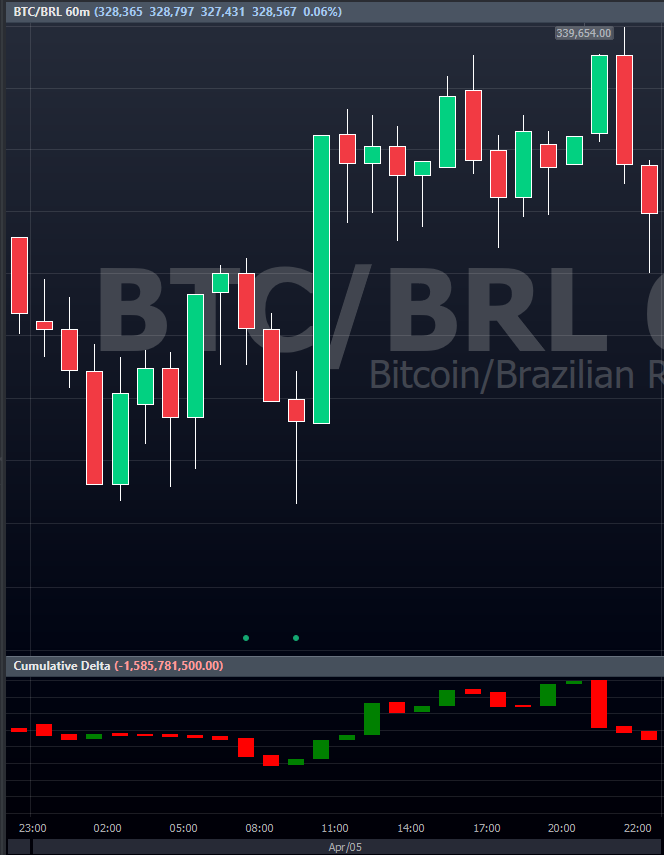
Cumulative Delta is an indicator that creates charts based on liquid aggression, separated by intervals.
Liquid aggression refers to the market participants’ balance. For example, if a participant buys 0.005 BTC and sells 0.003 BTC, their balance will be 0.002 BTC. This facilitates the analysis of balance variation and market strength indicatives.
To add Cumulative Delta to the chart follow the steps below:
Right-click the chart, select Add Indicator, and type Cumulative Delta:

A new candle chart will appear as shown in the image above.
Cumulative Delta is based on the liquid aggression amount. With a high amount (green bar) there is a greater accumulation of aggression from buyers during that interval. Likewise, when a red low bar is formed, it shows greater aggression from sellers.
The indicator will always be in the same time frame as the chart.
This indicator is used to observe aggression’s history and evolution per interval.
Access Properties by right-clicking the indicator and customize features like color and line style in the Appearance tab:

In the Parameters tab, adjust the Volume Type, set at Quantity by default, accounting for the total amount of contracts in the interval.
Financial: Shows monetary value per aggression candle.
Trades: Shows the number of trades per aggression candle.

Hey! Was this content helpful?
Please rate it below! It's important that we work together to make our Help Center even more complete.
Happy trading!