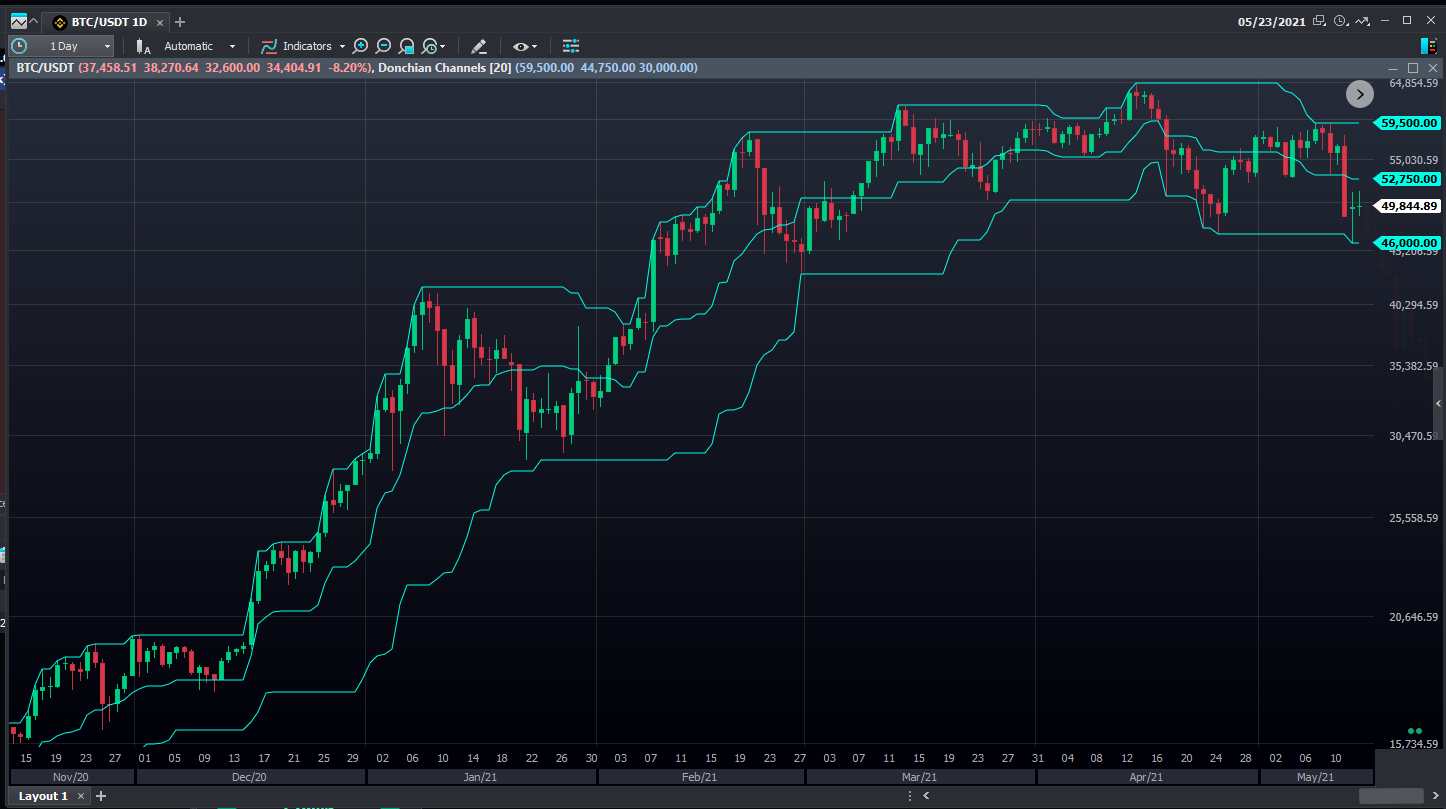
Channels are among the most appreciated technical analysis tools because they set visual limits, in which most of the price movement tends to happen.
Traders who use channels know that valuable information can be obtained at any given moment, whether the prices are in a band’s central region or close to one of the frontier lines.
The Donchian Channels indicator was developed considering the channels’ relevance in technical analysis. To add this indicator, right-click the chart, select Add Indicator, and type Donchian Channels:

Concept
Donchian Channels is a trend-follower indicator based on volatility and it is formed by three elements:
- Inferior band: delimited by the minimum of the last N intervals.
- Superior band: delimited by the maximum of the last N intervals.
- Central line: It’s not a moving average as in other indicators, but the central point between lower and upper bands.
We can notice a few interesting characteristics about the method’s components. The main one is that there are no average calculations, so the bands tend to react quickly to market changes.
When working with Moving Averages, even Weighted and Exponential ones, there is attenuation on the impact of each data in the general calculation. With Donchian Channels, an aggressive price movement will cause an equally aggressive reaction on the indicator’s part.
Using Donchian Channels
The method’s essence lies in the fact that a breach of one of the bands is a relevant (and often strong) move towards new highs or lows.
Besides monitoring volatility and following trends, this indicator uses the idea of breakouts to build operations.
The main rules of use can be described in the following way:
- When prices close above the upper line, it’s a buy signal.
- When prices close below the lower line, it’s a sell signal.
These events indicate the continuation and even acceleration of a trend. This technique signals favorable moments to enter the market while other tools are used for exit and risk management.
Because the Donchian Channels is a trend-following indicator, it may not be as efficient when the market is in lateral consolidation.
The indicator’s Time parameter indicates how many previous intervals it will monitor, 20 being the standard value. However, many traders operate in smaller values, seeking an even quicker reaction to price actions, especially in day trading.
It’s important to remember that the rules apply to market long and short entries only. For exits, stop orders, and risk management, other complementary techniques are recommended.
Hey! Was this content helpful?
Please rate it below! It's important that we work together to make our Help Center even more complete.
Happy trading!
