
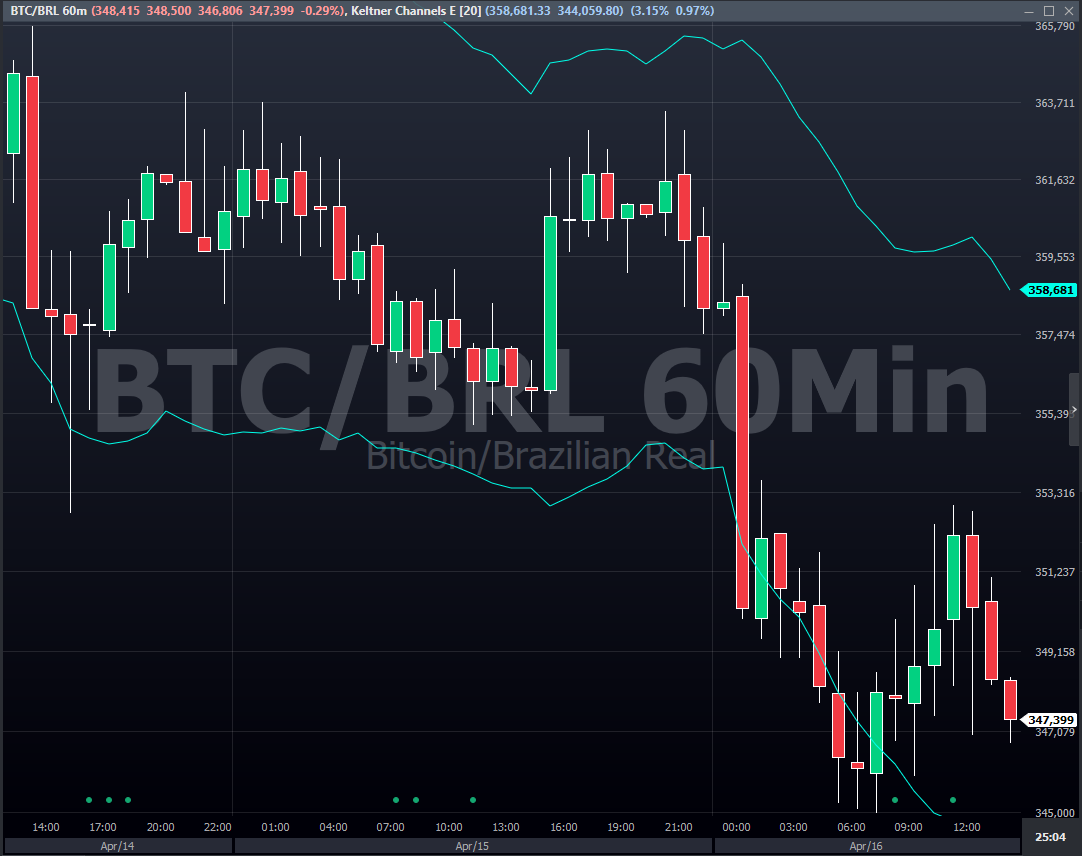
Developed to take advantage of the opportunities created by price volatility, Keltner Channels is a widely used indicator for short operations based on technical analysis.
This technique is similar to the well-known Bollinger Bands because it consists of two floating lines calculated from a central average value.
The technique was developed by a grain operator from Chicago called Chester W. Keltner. Since its launch, there have been different variations for the signals, most of them using exponential moving averages (which were not originally used by the author). Even so, all these modifications are grouped in the specialized literature under the name of Keltner Channels.
The calculation
Its calculation is based on what Keltner named “typical price”, referring to an arithmetic (simple) average of the maximum, minimum, and closing values of a determined interval. With the typical price, it’s possible to build a central line and that’s enough to calculate a simple moving average.
From the central line, two bands that will form the channel are projected, a superior and an inferior one. For that purpose, a moving average of the amplitude (the difference between the maximum and the minimum) is used in the calculation window.
Keltner Channels is available in all Vector products and it’s possible to add it through the following steps:
Right-click the chart, select “Add Indicator” and type “Keltner Channels”:
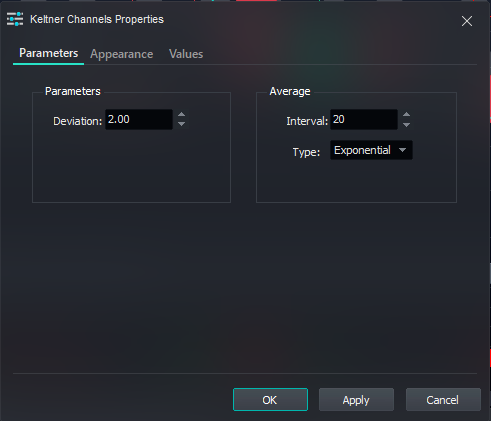
By right-clicking the indicator, it’s possible to customize its parameters and appearance:
Hey, did you find the content of this article helpful?
Don’t forget to rate us below! We know how important it is for us to work together so that we can make our Help Center even more complete!
Good trades!