
Before World War II, a Japanese journalist developed an indicator that became known as Ichimoku Cloud. Its name refers to the pseudonym used by its creator, Ichimoku Sanjin, meaning "a look across the mountain". The indicator is made up of five curves in total, and also two curves.
If in Candlestick, opening and closing prices are considered the most important, in Ichimoku the midpoints between high and low prices are the main parameter.
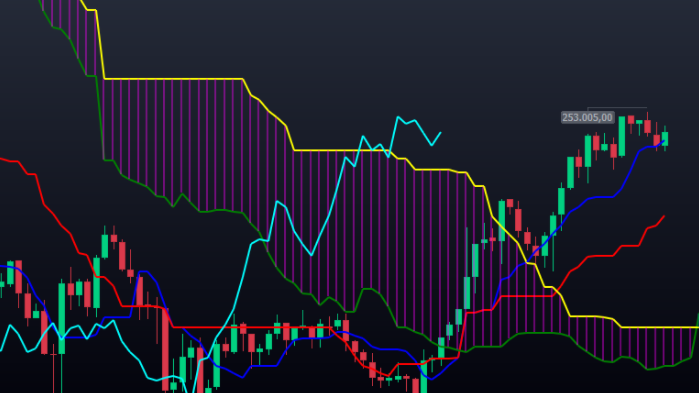
The five curves and the two clouds
Curves
- Tenkan-Sen: it presents similar behavior to a short-term moving average. The difference lies in the fact that the point on the curve is obtained by calculating the average between the highest maximum and the lowest minimum of the last 9 days, and not the closing price;
- Kijun-Sen: similar behavior to a long-term moving average. The curve point is obtained by calculating the average between the highest high and the lowest low of the last 26 days.
- Chikou Span: The third curve is a line chart of the closing price, delayed by 26 days.
- Senkou Span A: the fourth curve represents the result of the average of the first two curves (9 and 26 days), advanced in 26 days.
- Senkou Span B: The fifth curve also behaves similarly to a short-term moving average. However, it uses a period of 52 days, and it is also the graph of the "advanced" one, with a displacement of 26 days forward.
Clouds
Senkou Span A and Senkou Span B (4th and 5th curve) define the clouds.
- Cloud SpanA > SpanB
- Cloud SpanA < SpanB
Indicator customization
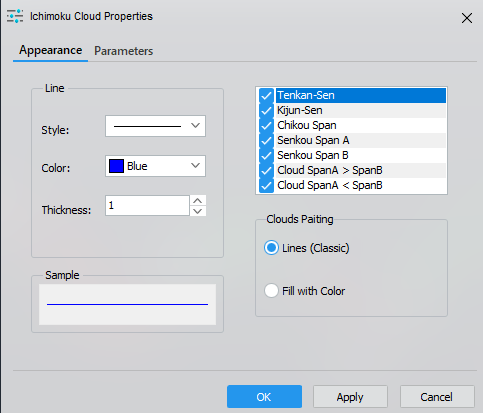
To change some characteristics of the indicator, just double-click on it. The Properties window will be exhibited and it will be possible to change the colors, thickness, and even disable the display of curves and clouds.
Understanding the structure
The five curves must be analyzed together, as one depends on the other. Reinforcing this codependency, let's start with the clouds, structures formed in the graph by curve 4 (called Senkou Span A) and curve 5 (Senkou Span B) that determine a region of support or resistance. Unlike the conventional, the break of support or resistance does not depend on a single price; the quotation must exceed a price range.
Another feature of the clouds: they allow the quick identification of a trend, as the indicator's name infers (Ichimoku means "a single look").
If the price is above the cloud (a supportive benchmark), we have an uptrend; and
If it's below the cloud (a resistance), there's a downtrend.
Curves 1 (Tenkan Sen) and 2 (Kijun Sen) are faster than the others and define the entry or exit timing of an operation. The crossing of these curves determines entry and exit points, as well as the crossing between the price and curve 2 (longer). The fundamental is the same as the conventional cross between a short moving average and a long moving average. A cross indicates a "momentum" gain, signaling the reach of the strength needed to initiate a trend.
For all of the above statements to be valid, the crossover must occur in the direction of the trend defined by the clouds. All Ichimoku curves need to be aligned.
Finally, look at curve 3 (Chikou Span). If the previous curves signal a rally, Chikou's current position needs to be above the real price curve. It is a visual way to compare the current price with a past period. If the current price is above the previous price, then there is an uptrend potential.
The incursion into the past provided by curve 3, and into the future (through the clouds) allows a better understanding of the market conditions. This is one of the most important features of Ichimoku, along with the integration of the concepts of trend, momentum, and support/resistance.
The Method
The Ichimoku method seeks to follow a trend that has already started, exiting the trade after signaling the next one (returning part of the profits). Therefore, when choosing the "wave to be surfed", it is wise to opt for one of considerable size. Using the averaging of highs and lows, as opposed to the conventional use of the average closing allows the trader to better understand the strength of a trend by showing the necessary volatility in price movements.
Keeping in mind that an uptrend is formed by ascending bottoms, while a downtrend is formed by a succession of descending tops.
Do you want to deepen your knowledge about the indicator? Watch our video on YouTube or the webinar below, prepared by Nelogica, our partner (content in Brazilian Portuguese):
Hey! Was this content helpful?
Please rate it below! It's important that we work together to make our Help Center even more complete.
Happy trading!