
The Price Volume Trend (PVT) is an indicator that fits the category of volumetric oscillators.
How to use it
The Price Volume Trend indicator is used mostly to identify divergences or to confirm the market trend.
We brought below two simple ways to spot divergences with the PVT indicator:
- If the prices are in an uptrend and the Price Volume Trend line is decreasing, we have a bearish divergence - this scenario represents the non-confirmation of the current bullish trend, alerting of a possible reversion;
- If the prices are in a downtrend and the PVT line is increasing, we have a bullish divergence - the bearish trend is not confirmed by the indicator, also supporting a possible trend reversal.
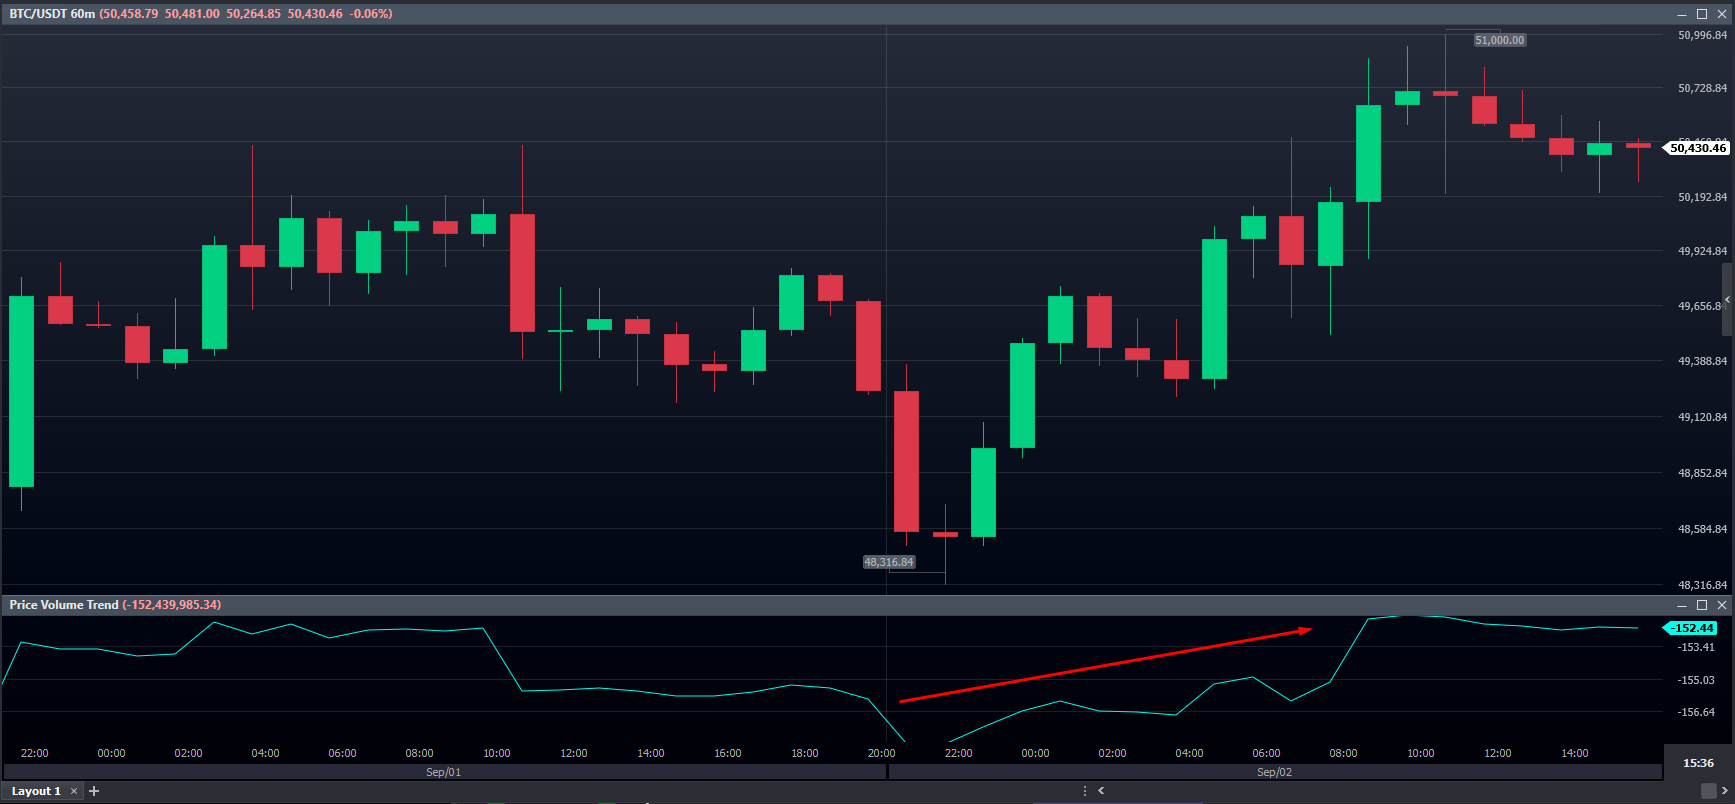
However, the PVT line confirms the trend when it agrees with price action about a direction.
Below, we have a BTC/USDT chart with the Price Volume Trend indicating that the price might rise.
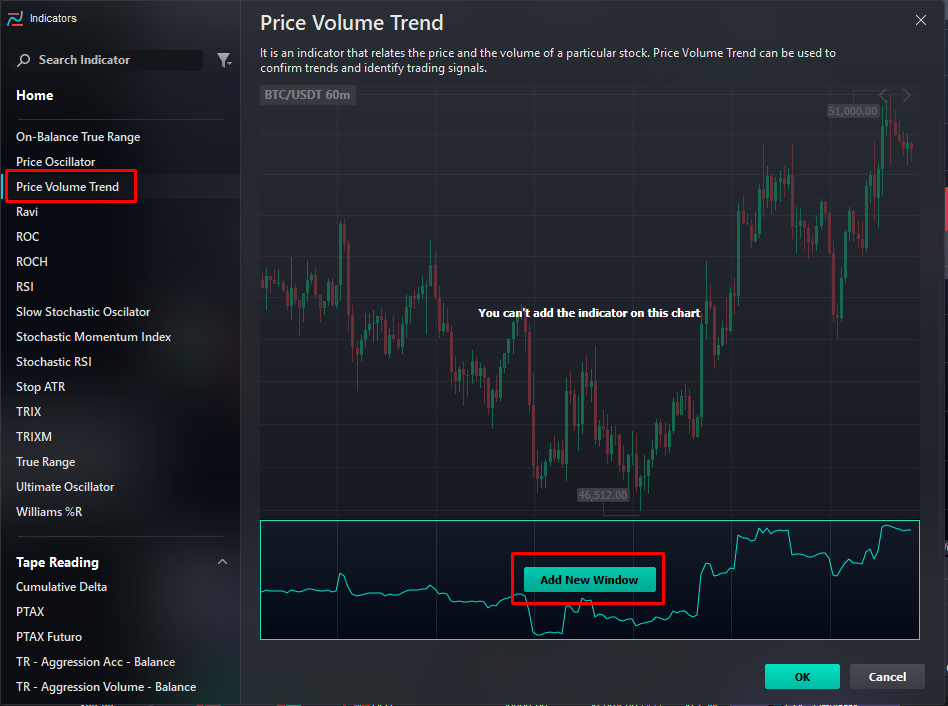
Adding the Price Volume Trend Indicator to your chart
To add this indicator, right-click the chart > Add Indicator > Price Volume Trend.
Hey! Was this content helpful?
Please rate it below! It's important that we work together to make our Help Center even more complete.
Happy trading!