
The Volume At Price shows the volume of trades performed on each available price for a selected asset, exchange, and interval. Visualize aggression, accumulation, distribution, and rejection price zones in real-time.
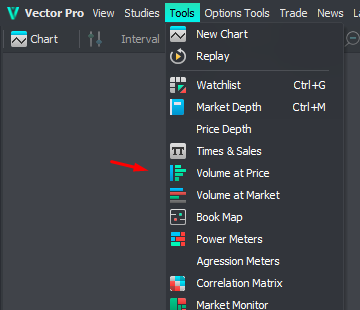
To add the Volume at Price to your desktop, access the Tools menu:
Views
Select the view containing the information most relevant to your analysis.
All views show the last trade highlighted in yellow.
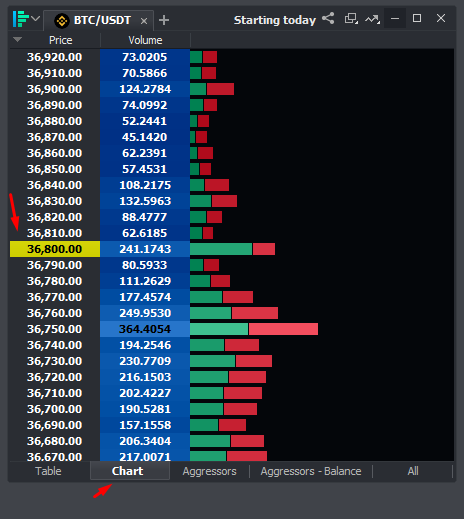
Chart
Shows total volume quantity for each price level.
The horizontal red and green bars represent aggression:
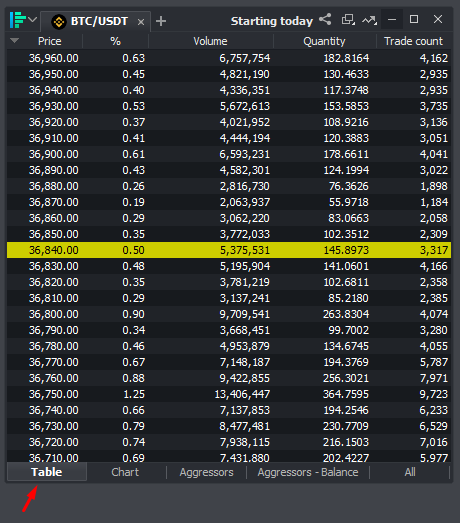
Table
The Table view displays prices, total volume, quantity traded, total trade count, and percentage for the selected interval:
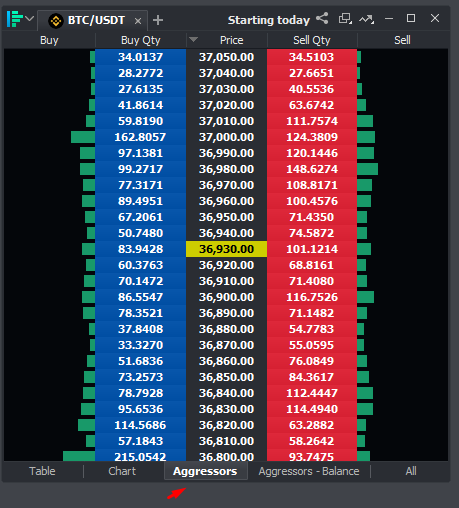
Aggressors
In this view, a central Price column separates buyer and seller information:
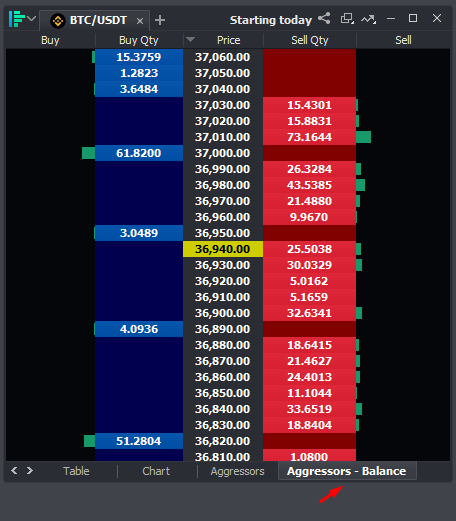
Aggressors - Balance
Shows origin of price aggression and quantity differences between buyers and sellers:
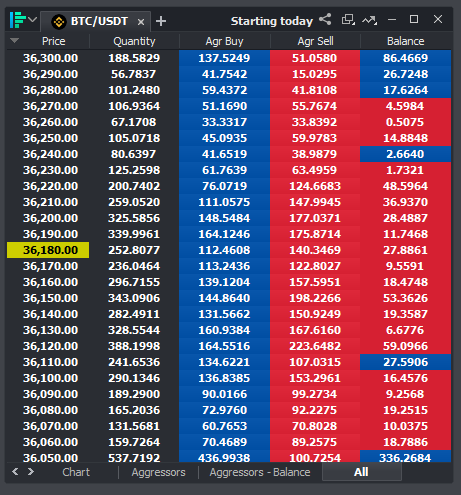
All
The last view displays price, total trade quantity, buyers and sellers aggression, and balance columns:
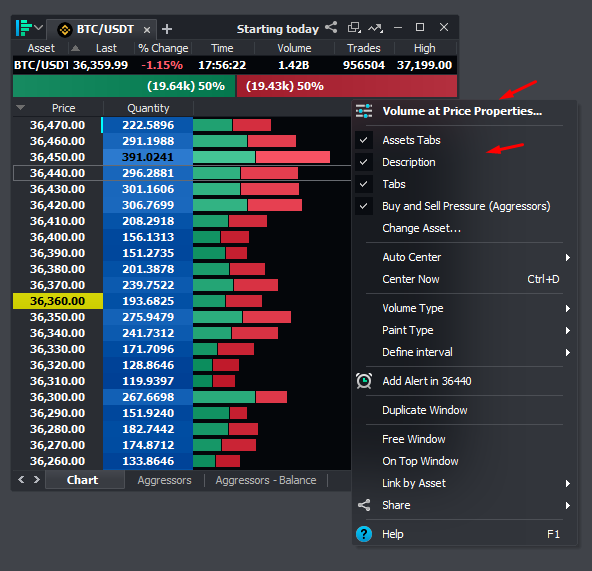
To add or remove features, right-click the tool to open the auxiliary Properties window:
In this example, the selected interval is Today:
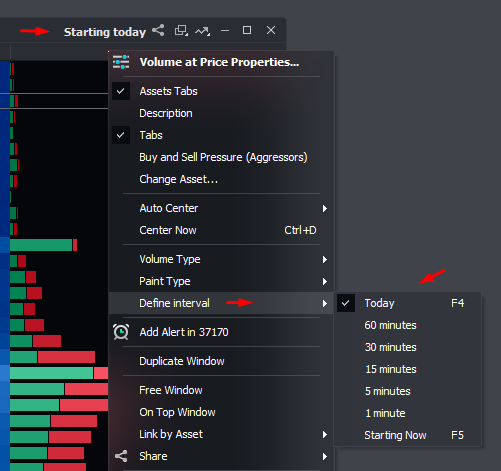
Click Volume at Price Properties to customize interval and to select trade type:
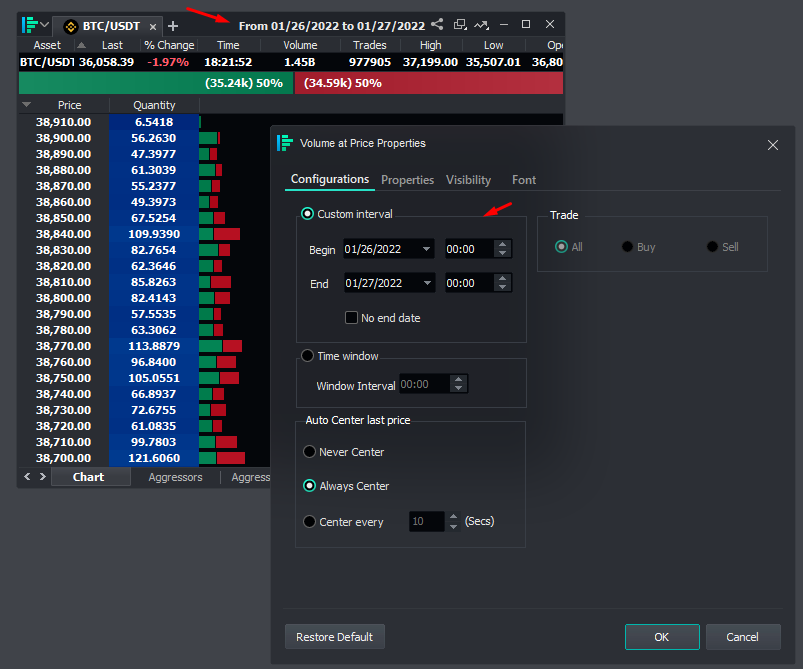
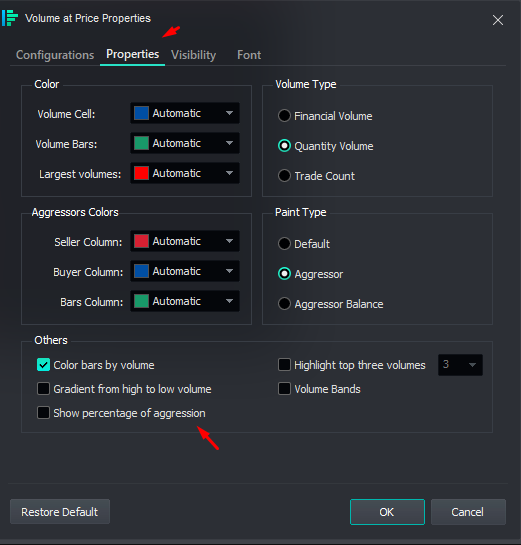
Access the Properties tab to apply colors, gradients, and highlights to cells, bars, and columns:
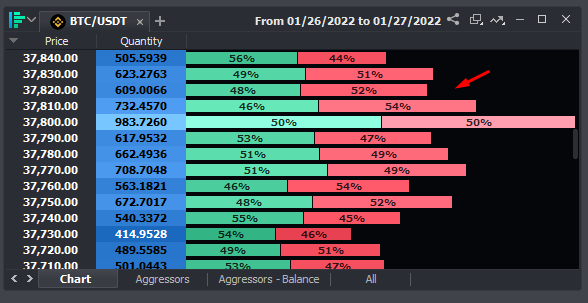
When selected, the option Show percentage of aggression displays values in the corresponding bars:
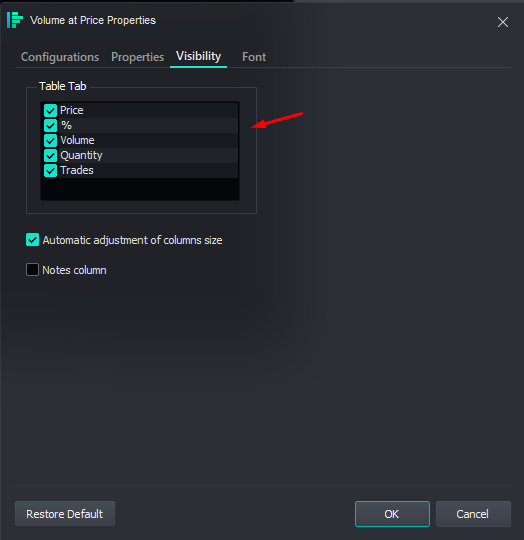
In Visibility, add or remove columns shown on Table:
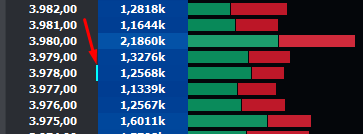
The small blue bar shows where the VWAP indicator is positioned for the selected interval.
This setting is default and can't be changed.
Volume at Price on Vector Basic
Vector Basic is a platform developed primarily for technical analysis. Flow reading tools have reduced features to avoid unnecessary data processing.
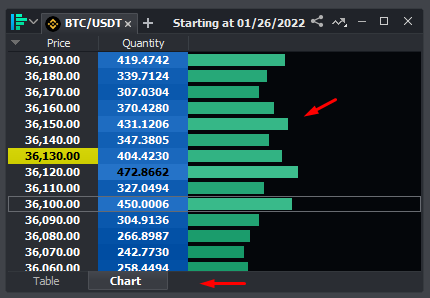
The Volume at Price tool contains Table and Chart views, with green only aggression bars:
Was this content helpful?
Please rate us below.
Happy trading!