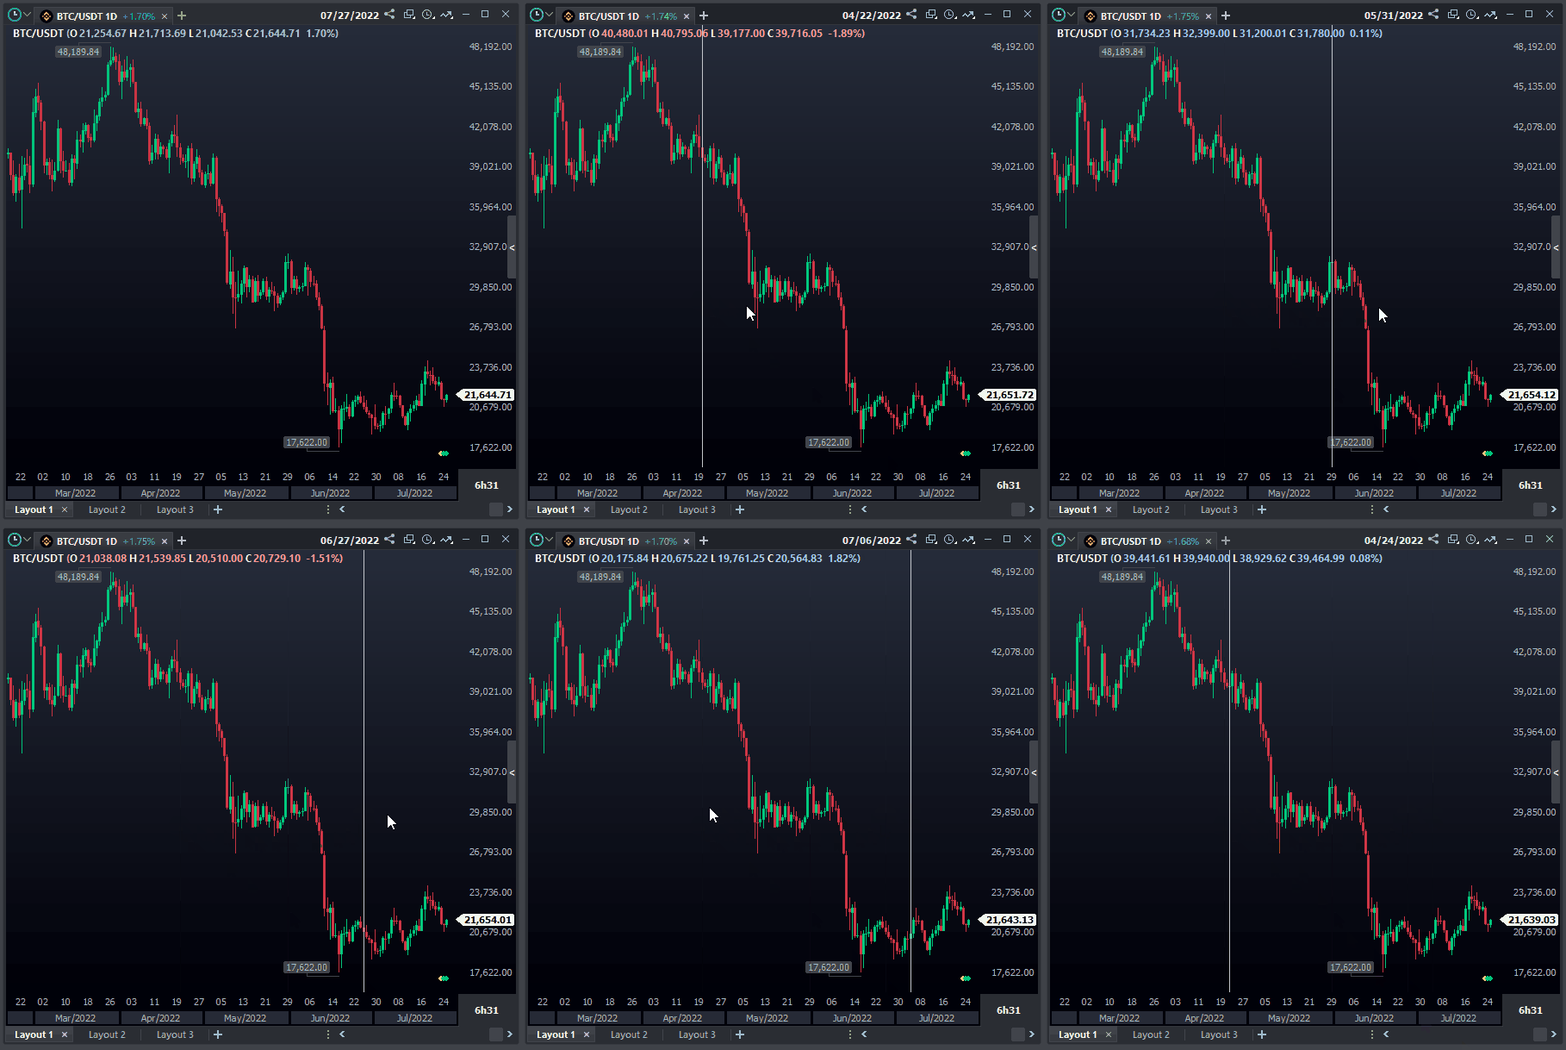
The enable date selection function on the chart allows you to identify with just one click the candle information that is at the selected point. To simplify this visualization, a vertical line that crosses the entire chart is displayed.
When the functionality is active, the opening, maximum, minimum, and closing data that are in the upper left corner, next to the asset code, will be respective to the point that was selected/clicked on.
Many times it may seem that the platform is showing the incorrect market value or that the price is not updated in real time, since it does not refer to the current candle. However, this is not an error, but the expected functioning of this tool.
By having the selection active, it is possible to quickly identify important data from past trade sessions/candles without having to wait for the day's summary to be displayed. Notice in the animated image below that the values at the top of the chart vary according to the point selected, as well as the date in the upper right corner. At the end, when you click again on the vertical line, it disappears and the data become respective to the last candle.

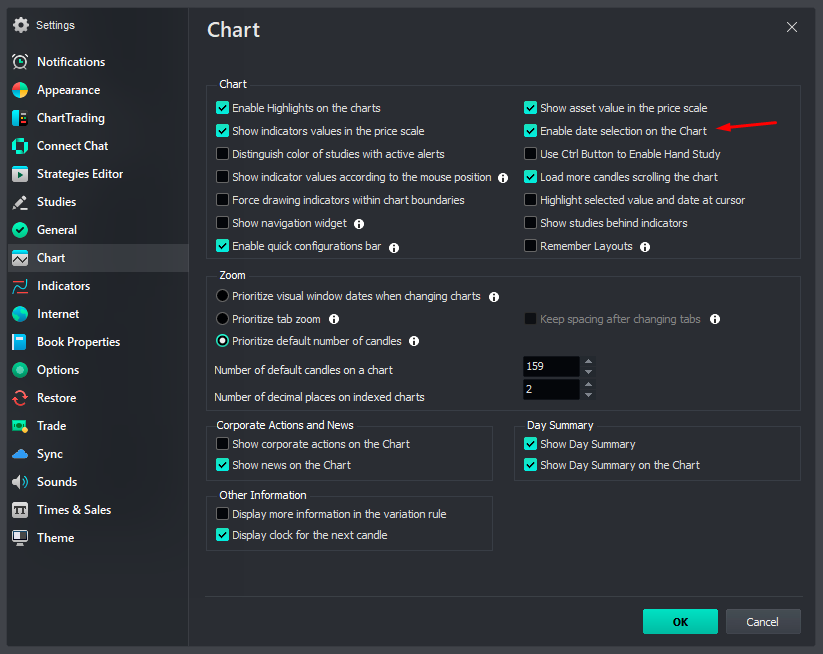
In the platform settings window, access Chart, to enable or disable the option:

Was this content helpful?
Please rate us down below.
Happy trading!