
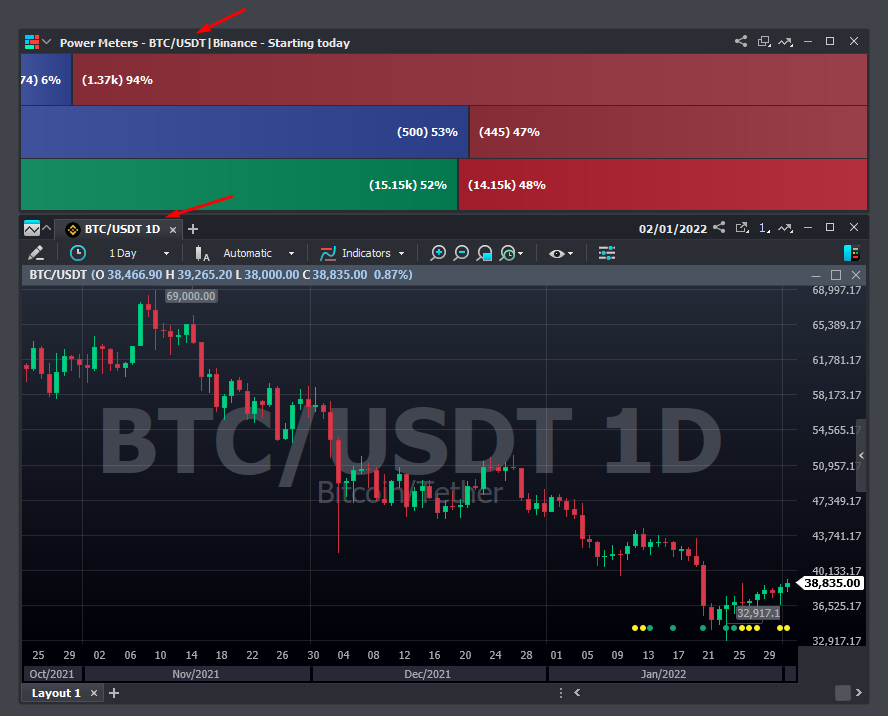
The Power Meters tool points out the direction of a cryptoasset's price and the prevailing pressure in a given period, displaying the amount of trades carried out, offers and aggression:

On the left side, in blue and green, the data from the buyer side is displayed.
In red, on the right side, the number of contracts traded, offers and aggression on the seller side is displayed.
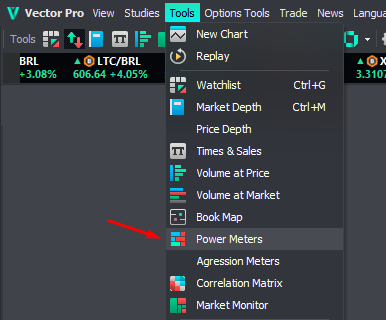
To add it to your desktop, access the Tools menu:
The window will bring up whichever asset is selected on the chart. To change it, select the chart of the desired asset and open a new window afterwards.
Settings
To quickly select the displayed interval and lines, and also enable the information tab viewing on the asset, click on the arrow next to the tool icon:

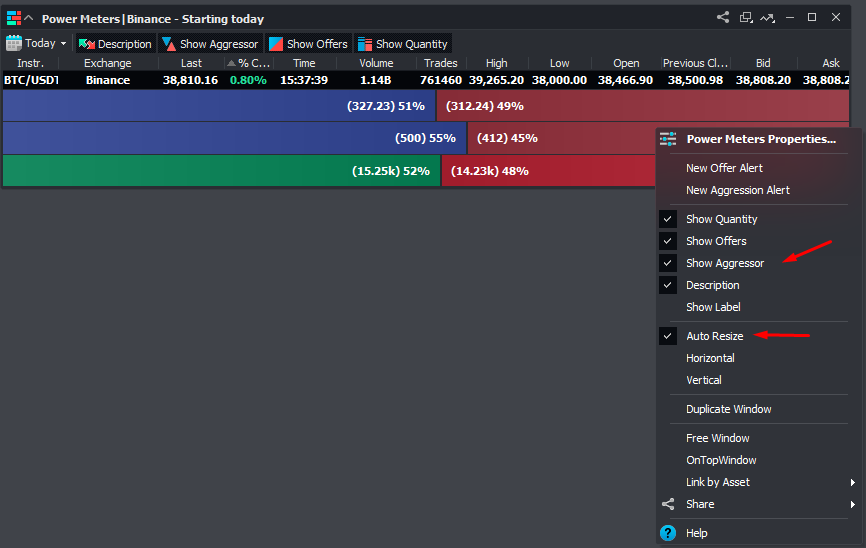
Or right-click the window to open the Properties.
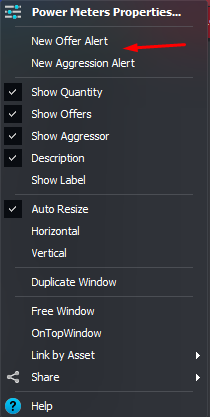
- Select the options you wish to exhibit: Quantity, Offers, Aggressors and Description to increase the amount of information exhibited on the lines.
- Choose either Horizontal or Vertical for the window format. The Auto Resize returns the window to its initial size and position:
Click on Properties to set up intervals, colors, font and considered prices.
In the example below, we’ve selected the Time Window option with a 1-hour interval:
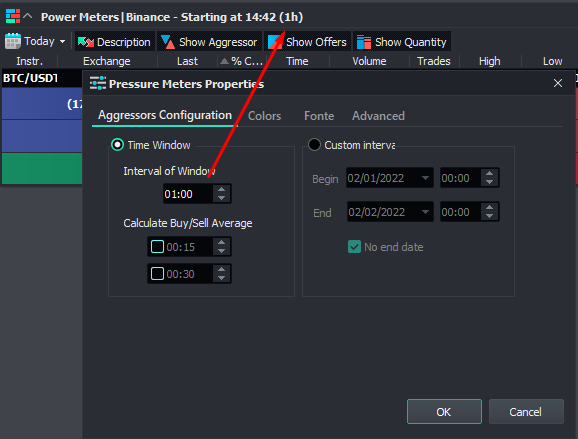
- In Calculate Buy/Sell Average, add the aggression averages of other intervals to the results, such as 15 and 30 minutes.
- View longer times by setting up a Custom Interval.
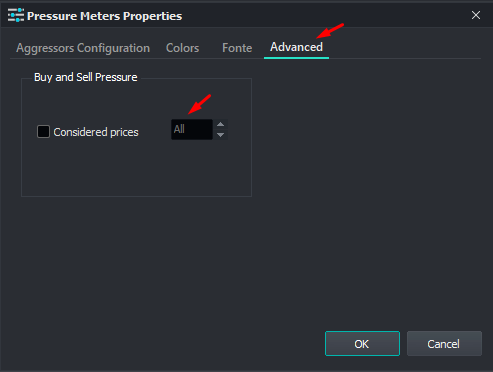
- On the Advanced tab, the Considered Prices option brings the default setting All. To limit the prices closest to the spread (difference between buy and sell prices) display, select the option and define the amount of Ticks:
Offer and Aggression Alerts
To set up alerts, right-click on the tool again and select the type of alert you wish to use:
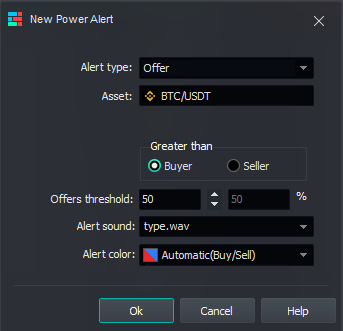
The alerts below demonstrate the default configuration.
For the Offer type, the configuration determines that the alert should be triggered if the amount of offers on the buying side is greater than or equal to 50%:
For the Aggression type, the default configuration determines that, if within one hour the aggression on the buyer's side is equal to or greater than 50%, the alert must be triggered:
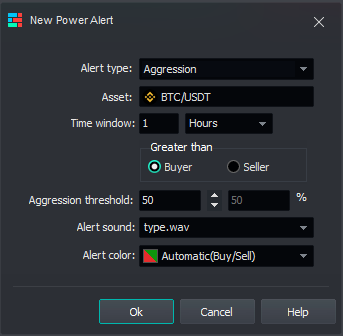
Change the values as you wish and add sound and color to the alerts.
Click on Ok and Cancel to finish.
There is no limit on the number of chart windows or tools you can open on the Vector Standard and Pro versions.
Was this content helpful?
Please rate us below.
Happy trading!